Planboard
Plan, track, and visualise work directly in Reqtest – without the need for a separate tool. The Planning Board brings together tasks, requirements, bugs, and test cases in a single view.
- Add tasks and relevant information
- Link tasks to requirements, bug reports, and test cases
- Structure work in columns and groups
- Mirror requirements directly on the board via mirror link
- Track progress in list, kanban, or Gantt view
Planboard demo
Key features of the Planboard
The Planning Board in Reqtest is built around the following core concepts:
Tasks – The fundamental unit of the board. Tasks can be created directly on the board or added from a requirement, bug report, or test case.
Columns – Columns represent stages in your workflow, such as Backlog, In Progress, and Done. Status and column are synced – moving a task to a new column automatically updates its status.
Groupings – Organise tasks by row, assignee, or priority for a structured overview.
Linked tasks – Connect a task to one or more objects in other modules – requirements, bug reports, or test cases – as a reference. No data is synced.
Mirror link – Create a live copy of a requirement, bug report, or test case on the board. Changes made to either the mirrored object or the board are automatically synced in both directions.
Getting started with the Planboard
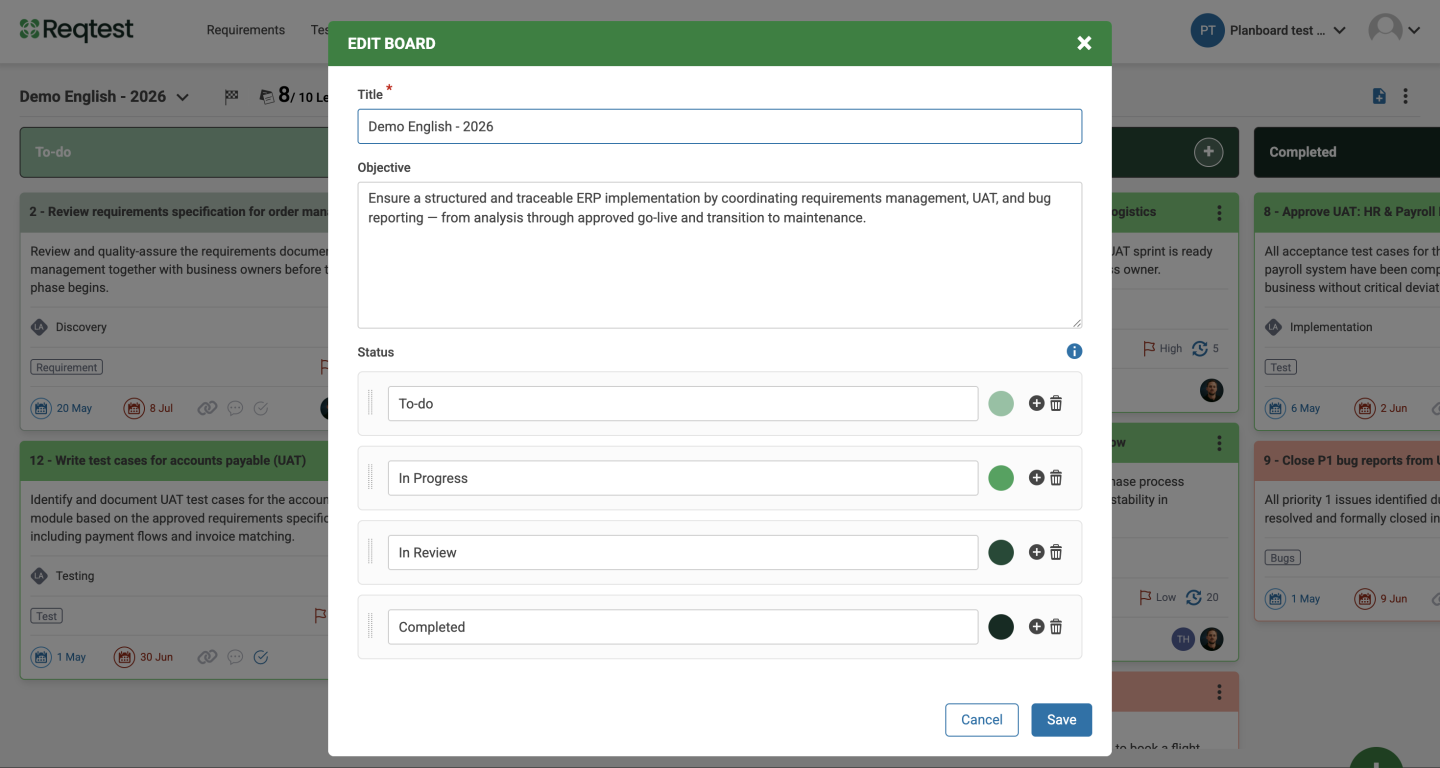
To create a new board, click the plus icon. Enter a name and an objective, then add the columns you want from the start.
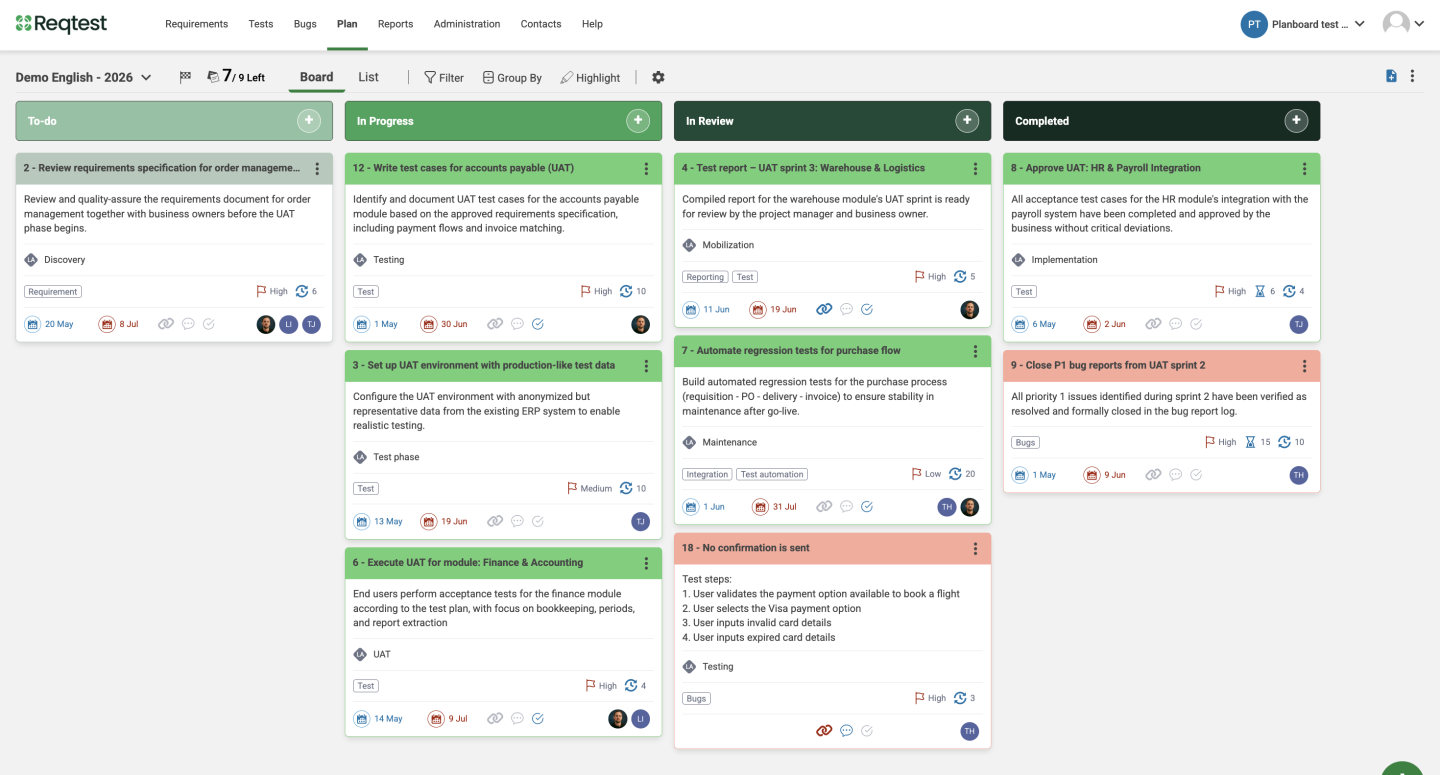
The board consists of tasks organised in columns, rows for horizontal structuring, filters and groupings to highlight what is relevant, and reports to track progress.
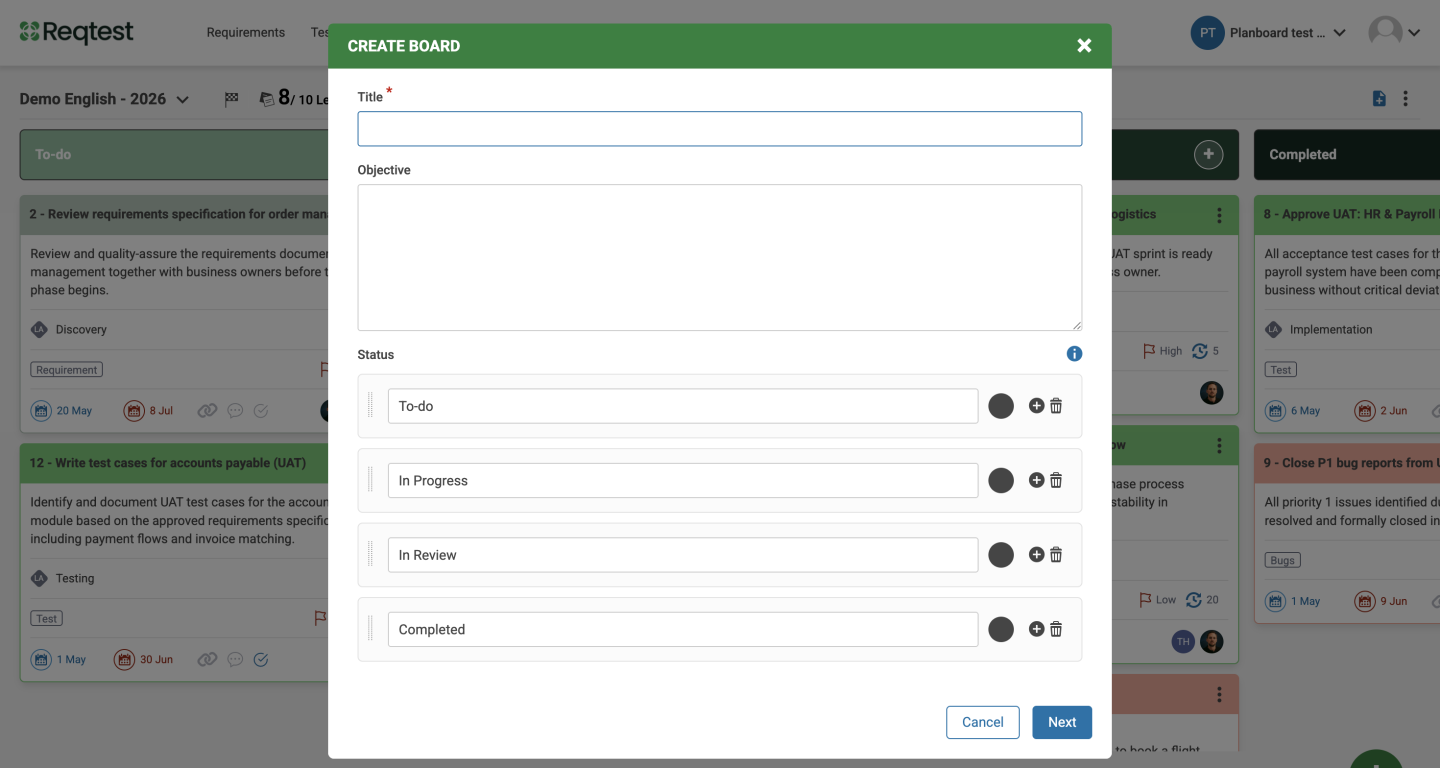
Columns
Columns define the stages of your workflow and are linked to task status. Moving a task to a new column automatically updates its status.
Adding columns
Default columns are To do, In progress, In review, and Done. You can choose how many columns to have and what to name them. Open the board’s kebab menu and select Edit board to rename, add, remove (minimum 2 required), or recolour columns.
- Rename a column by clicking its header
- Add columns using the + icon
- Remove columns you no longer need (at least 2 must remain)
- Assign a colour to each column header for visual clarity
Common workflow examples:
- Basic: To do, In progress, In review, Done
- With review: Backlog, In progress, Review, Done
- With testing: To do, Development, Test, Released
Pop-up when moving to the final column
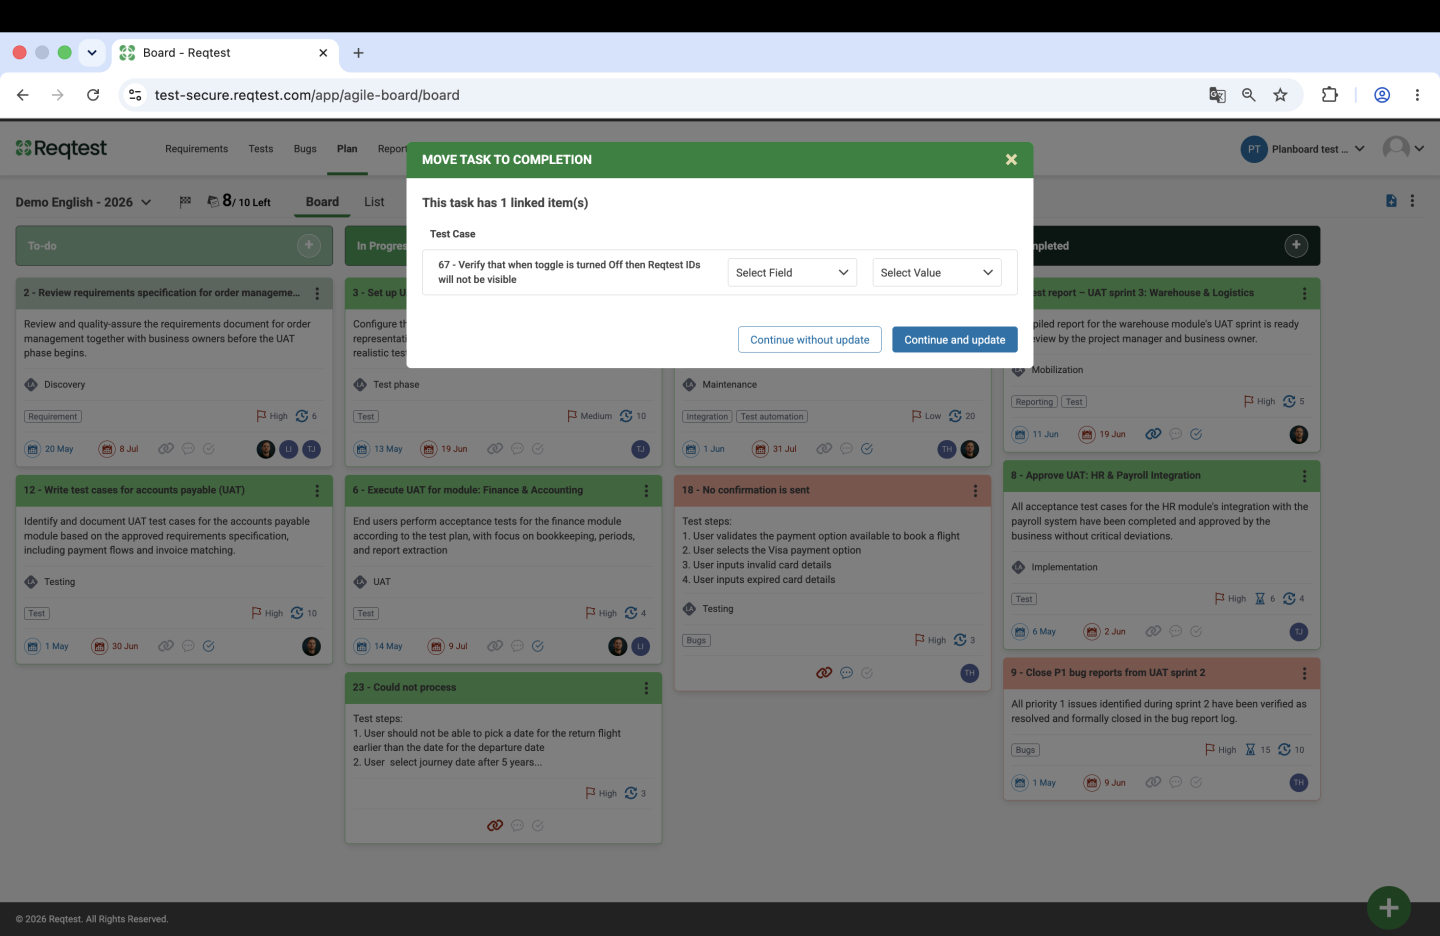
When a task with a normal link is moved to the final column, a dialog appears. You can choose to update a field in the linked object (e.g. status) or proceed without changes.
For mirror links, status updates occur automatically through the field mapping – no dialog is shown. (See Links and mirror links for more information.)
Tasks
Creating a task
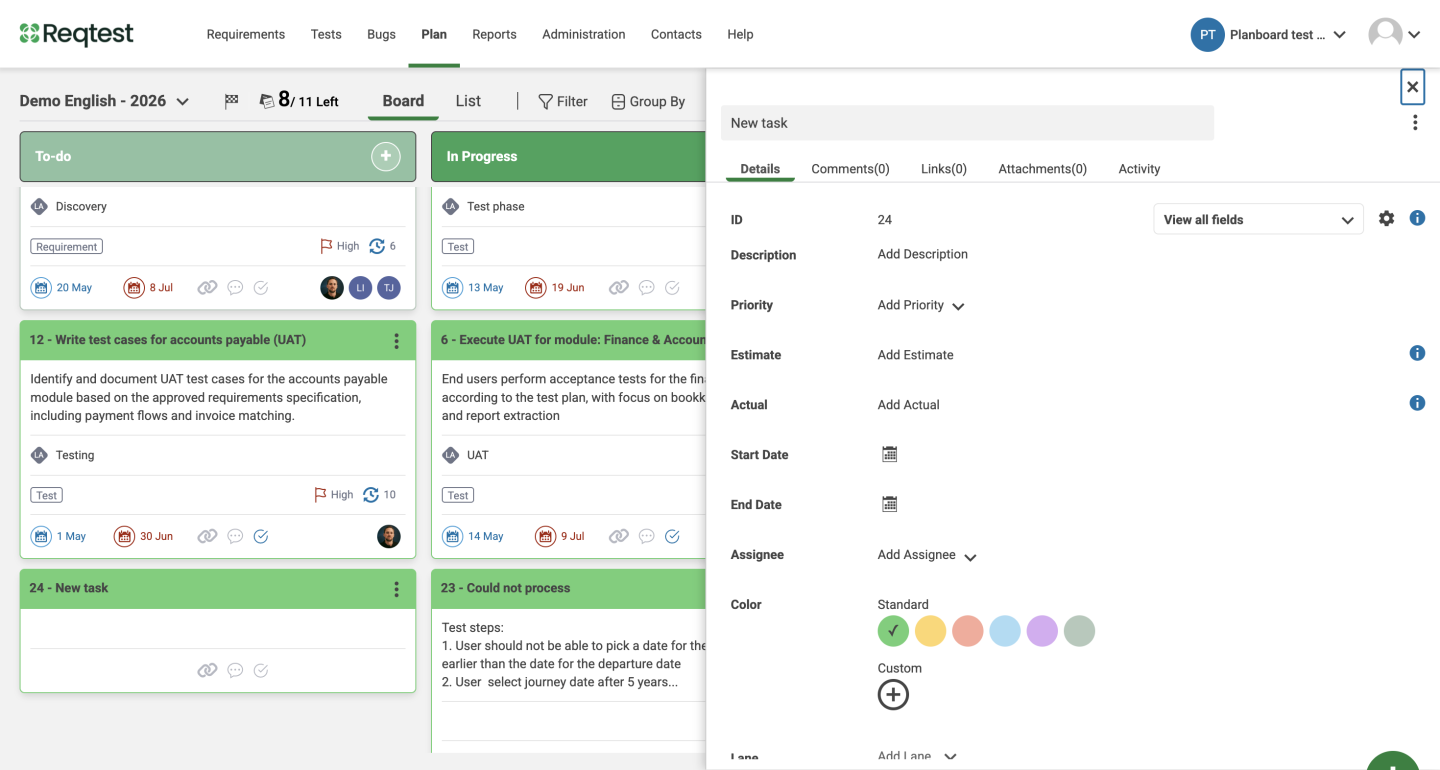
Click the + icon in any column to create a task. Tasks can be created directly in any column.
Fields available to fill in:
- Description – Describe the work to be done.
- Priority – Set the task’s priority relative to others.
- Estimate – Enter the estimated time required.
- Date – Set start and end dates to define the task’s timeline.
- Colour – Assign a colour for visual identification on the board.
- Assigned – Assign the task to one or more team members.
- Row – Place the task in a row to organise work horizontally.
- Tags – Add one or more tags for categorisation.
- Status – Reflects the task’s current column. Updated automatically when the task is moved.
- Checklist – Add sub-items and mark them as complete as work progresses.
Start dates are displayed in blue and end dates in red on the task card.
Changes to tasks are saved automatically – there is no need to click Save.
Assigning a task does not send an email notification to the assigned person.
Editing existing tasks
Click on a task to open the task panel and edit its details. All users with access to the board can edit tasks.
Customise fields
Use the gear icon in the task panel to select which fields are displayed.
Comments, links, attachments, and activity log
The top menu of the task panel provides access to comments, links to other objects, file attachments, and an activity log showing a full history of changes – including who made each change and when.
Moving tasks
Drag a task to a new column to update its status. When grouping is active, the grouped field is updated automatically – for example, reassigning a task by dragging it from one assignee’s group to another.
Copying tasks
In list view, select one or more tasks and click Copy to duplicate them to another board. All task details are retained. Tasks are placed in matching status columns where available, or in the first column if no match exists.
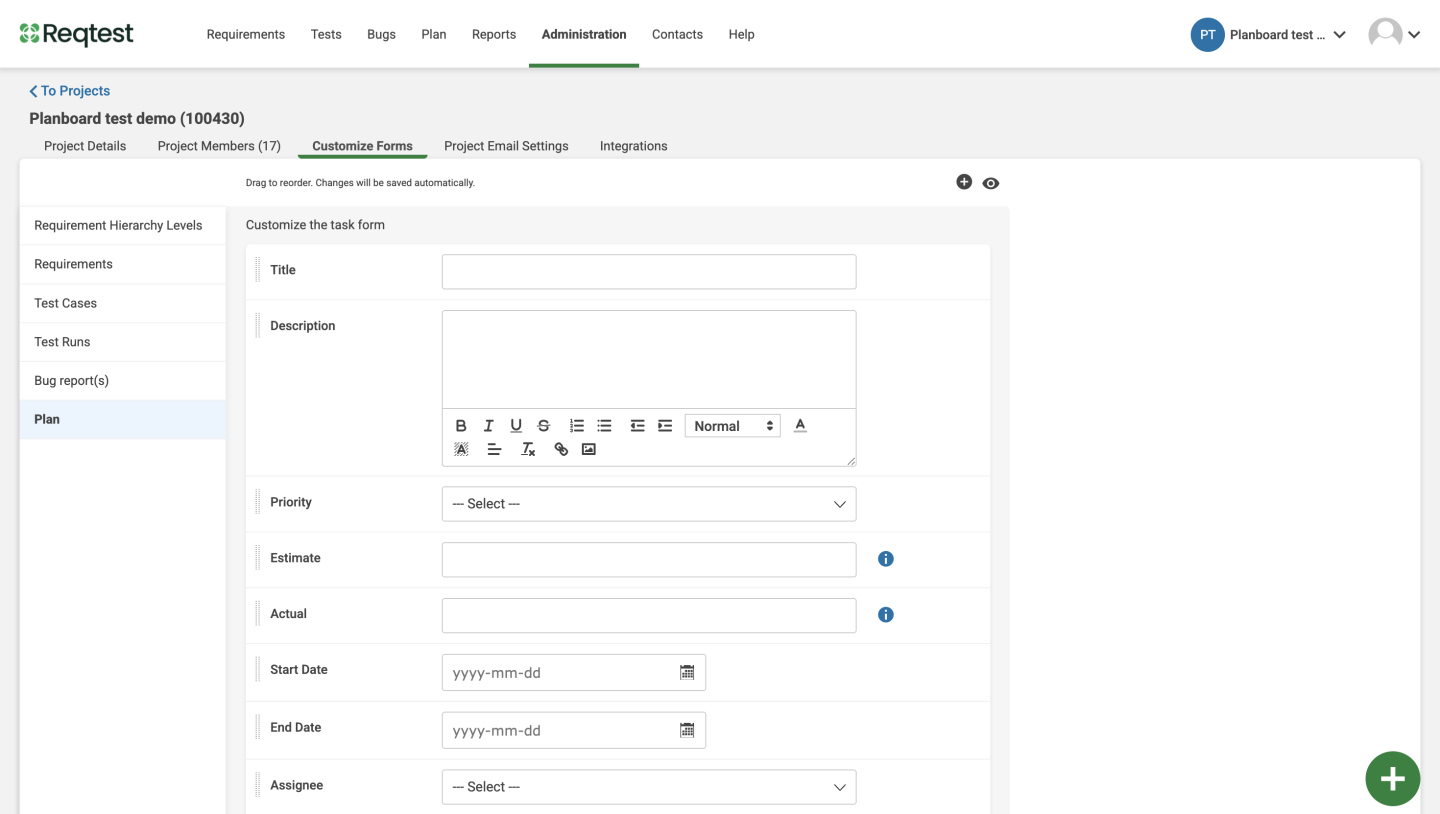
Custom fields
Default fields include title, description, priority, assignee, date, estimate, actual time, tags, row, status, and checklist. Additional fields can be created under Project Settings > Customize Form.
Links and mirrored links
A task can be connected to objects in other modules – requirements, bugs, test cases, test runs, and hierarchy levels – in two ways:
- Normal link – A reference without automatic synchronisation. A task can have multiple normal links, including from different modules. Indicated by a blue link icon.
- Mirrored link – A live copy. Changes made to either the task or the original object are automatically synchronised in both directions. Indicated by a red link icon.
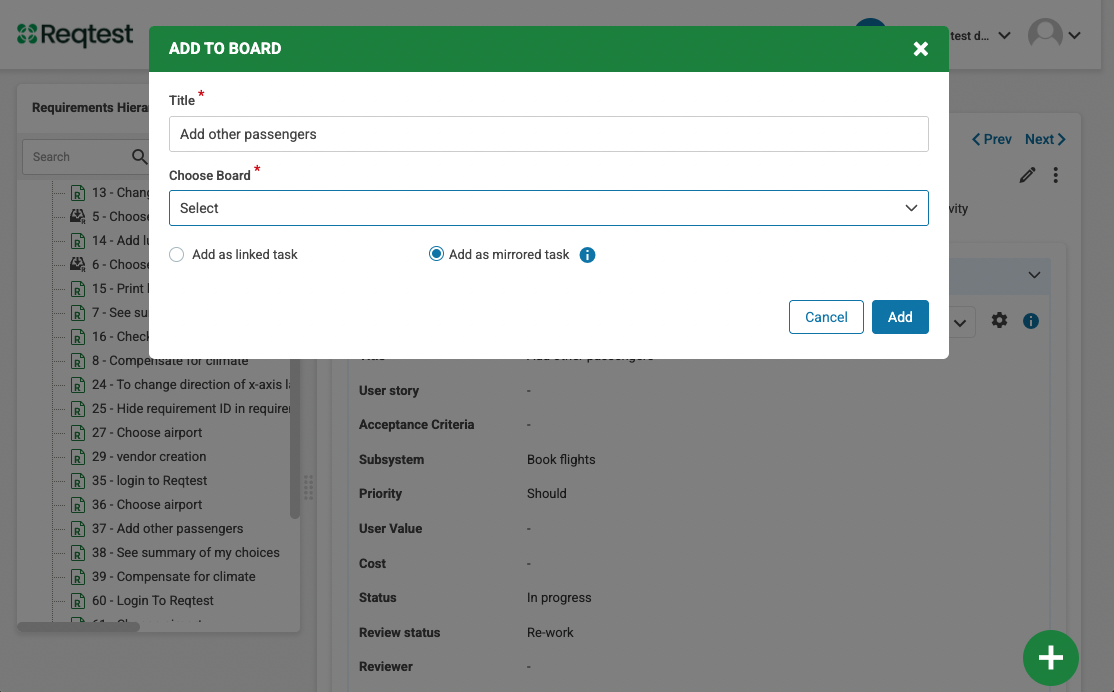
Creating links and mirrored links
Mirrored links are always created from the original object, not from the board.
1. Open the object you want to mirror (requirement, bug, test case, etc.)
2. Open the kebab menu and select Add to board
3. Select the board, then choose Add as mirrored task or Add as linked task
4.Click Add
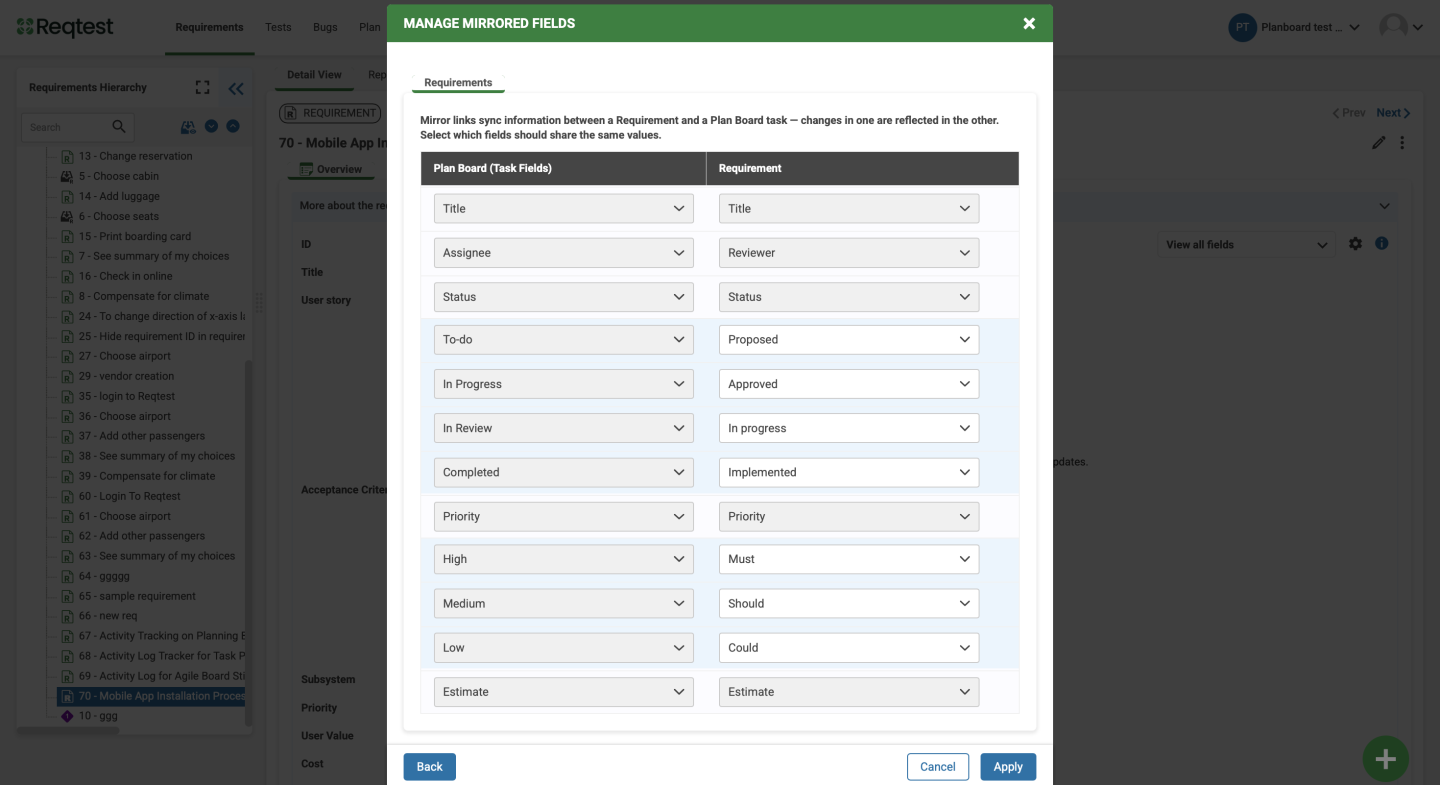
Configure a mirrored link
When adding a mirrored task, define which fields should be synchronised. The mapping view shows the task’s fields on the left and the source object’s fields on the right. The system suggests automatic mappings based on field type – for example, title to title and priority to priority. Fields that cannot be matched are shown as No match and can be removed.
For the status field, an additional step allows you to specify which status values in the source object correspond to which columns on the board. Only fields of the same type can be mapped, and mappings can only be modified by the board owner. Mappings can also be updated after creation via the gear icon on the board, under Manage mirrored fields.
Changes are automatically synchronised in both directions. When the status field is mapped, a task moves to the corresponding column when the original object’s status changes – and vice versa. Unmapped fields are not synchronised and can be edited independently.
Limitations
- A task can only have one mirrored link
- Mirror links must be created from the original object, not from the board
- An existing task cannot be converted to a mirrored task retrospectively
- If an object is already mirrored and a new mirror is created, the existing mirror is converted to a normal link – a warning is shown before this occurs
- When a board is duplicated, mirrored links are transferred to the new board and removed from the original
Removing a mirror link
Open the Links tab in the task panel, hover over the mirrored link, and click Remove. The link is converted to a normal link and synchronisation stops. The task and all its data are retained.
Archiving and mirrored links
- Archive the board – All mirrored links are broken and converted to normal links. Restoring the board does not reinstate the links.
- Archive an object – The link and synchronisation remain active.
- Delete an object – The mirrored link is removed. The task remains on the board as a standalone task.
Lists
The Planninboard offers three lists to suit different ways of working. The Kanban view gives a quick overview of the workflow, the list view is suited for managing or filtering larger volumes of tasks, and the Gantt view displays work against time.
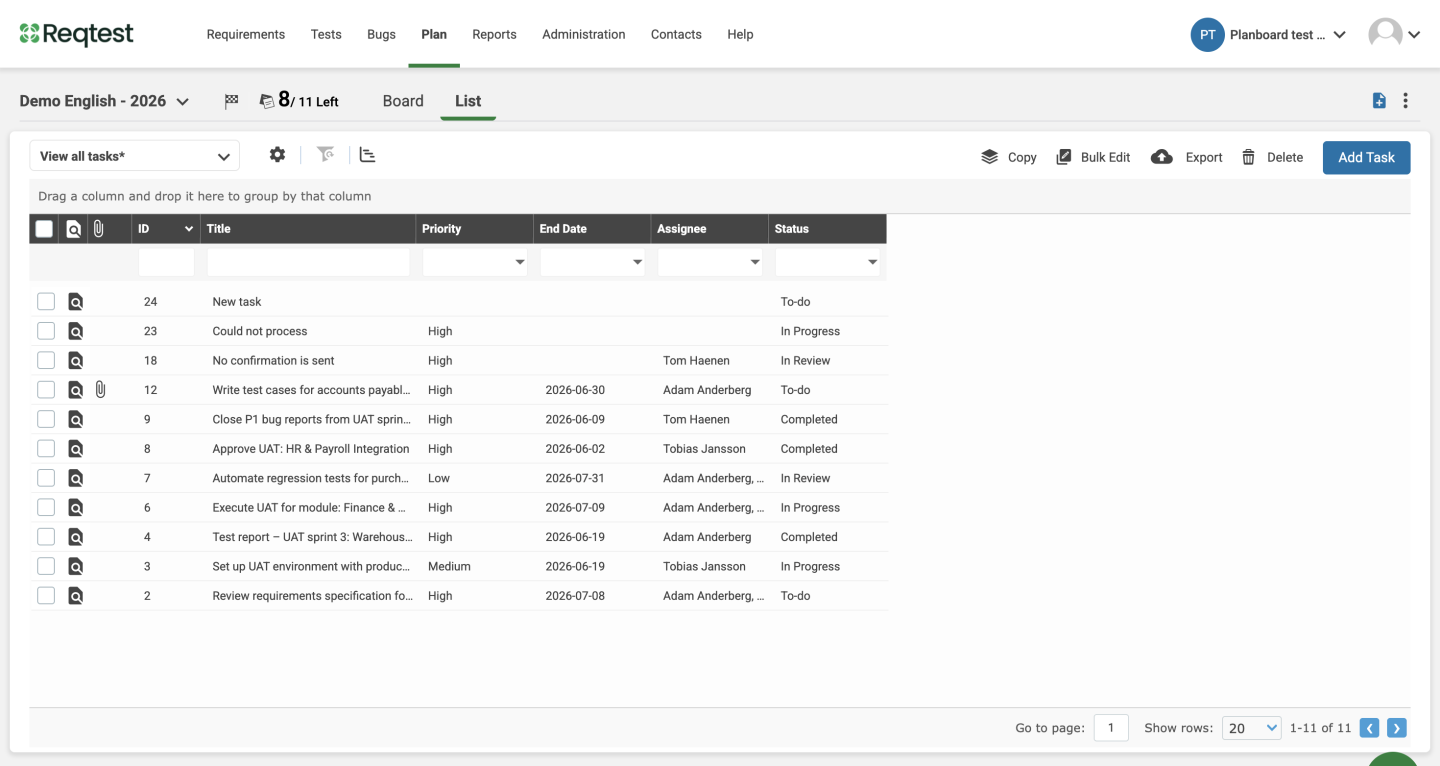
List view
Displays all tasks in a sortable grid. Use Show/hide fields to control which columns are visible. In list view, selected tasks can be copied, bulk edited, exported, or deleted.
Gantt view
Switch to list view and click Show Gantt bars in the toolbar. Each task is displayed as a horizontal bar spanning its start and end dates. Tasks without dates are not represented as bars.
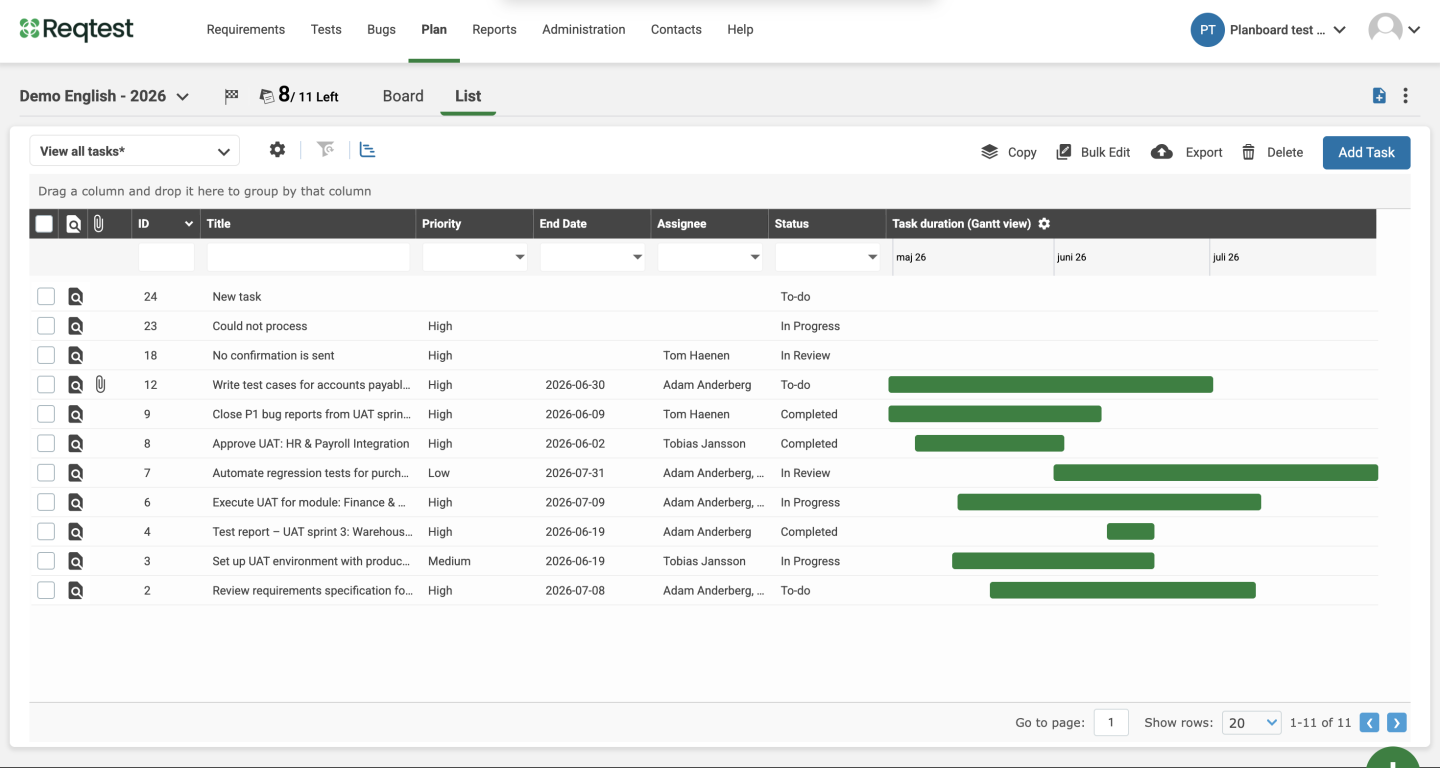
The Gantt view makes it easy to identify overlapping tasks and tasks that are missing date information.
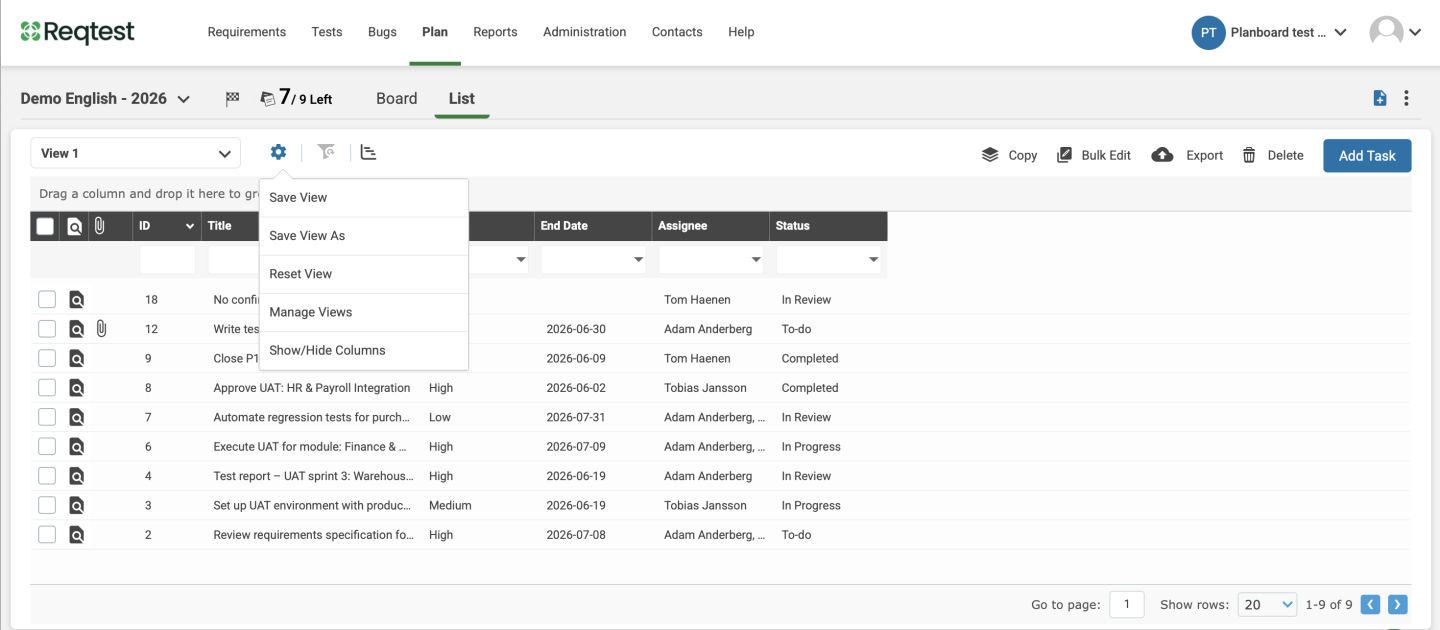
List settings
Use the gear icon in the list view to save and manage your views.
- Save view – Saves changes to the active view.
- Save view as – Saves the current configuration as a new named view and share it with your team.
- Reset view – Restores the view to its last saved state.
- Manage views – Manage your saved views and choose which ones to share with the team.
- Show/hide columns – Select which columns are visible in the list view.
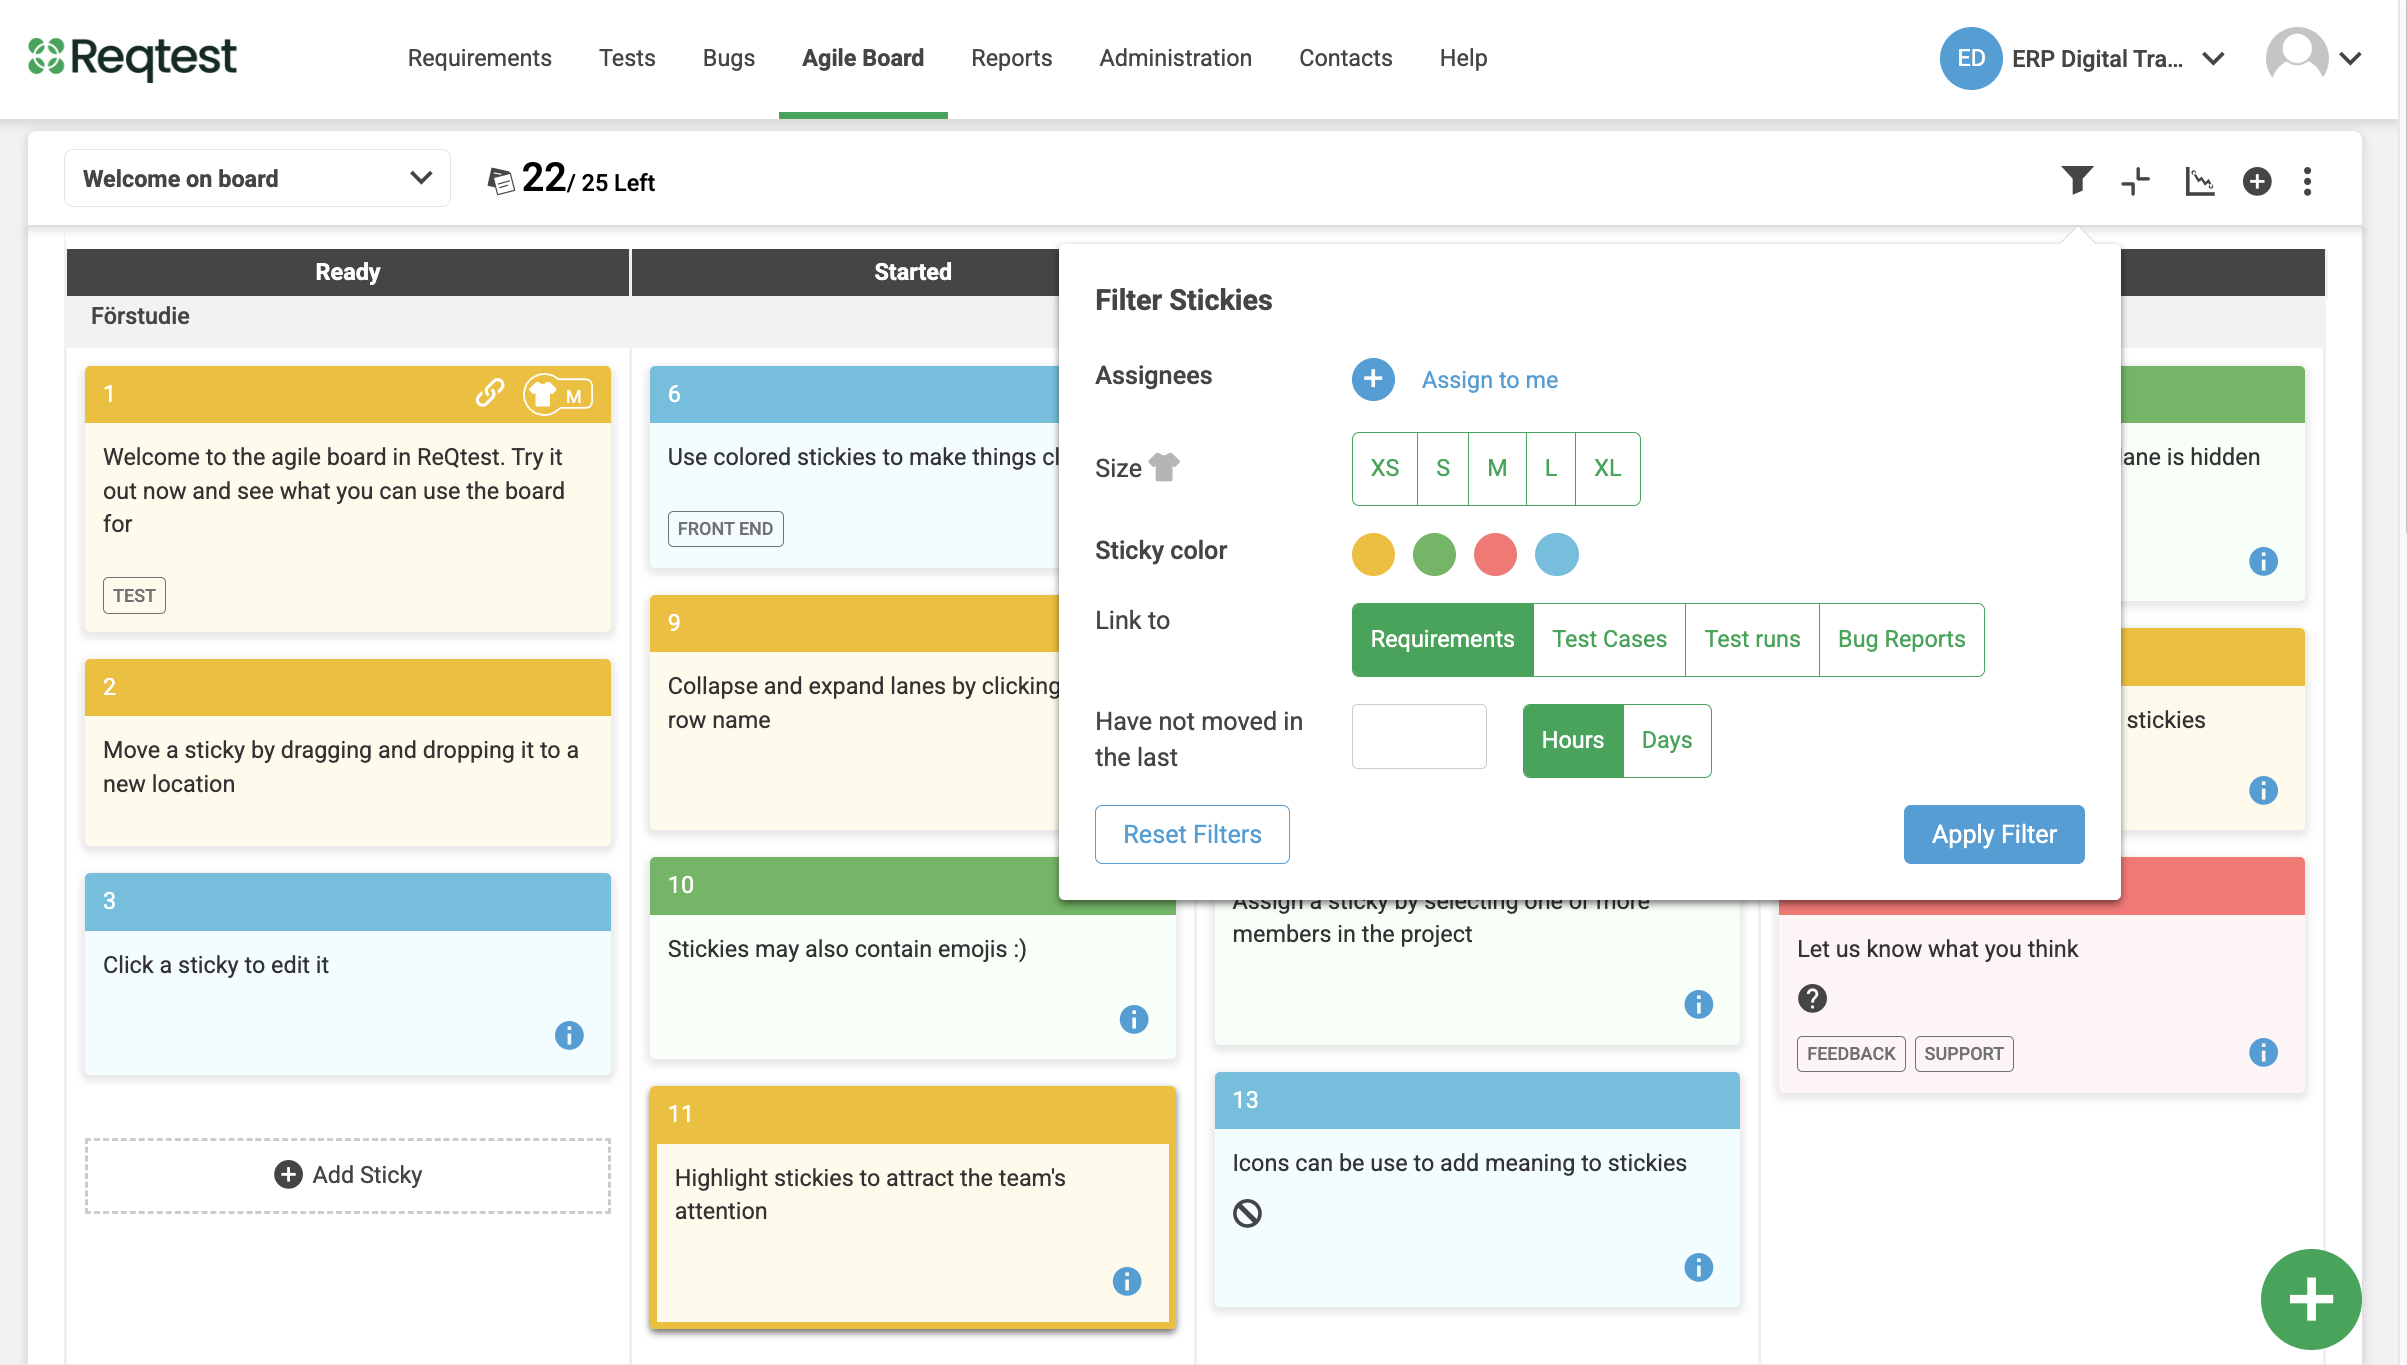
Filters and groupings
Filter
Click Filter in the toolbar. Filter by assignee, priority, status, tags, rows, end date, or linked objects.
Quick filters: Assigned to me, Overdue, Recently updated, Done this week.
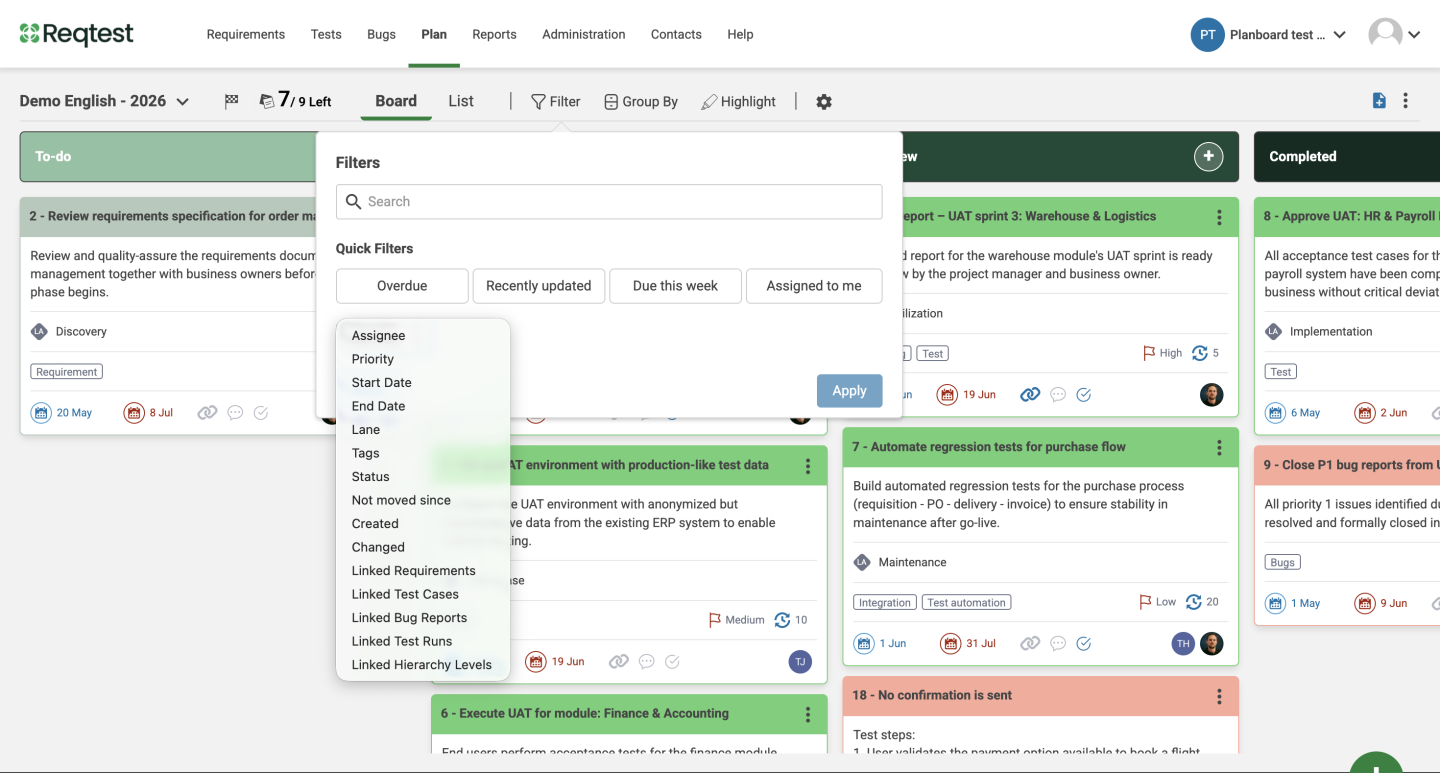
Filters are saved per user and do not affect other users’ views.
The Overdue quick filter surfaces tasks whose end date has passed and that are not in the final column.
Grouping
Click Group by and select a field to divide the board into horizontal sections by value. Dragging a task to a new group automatically updates the corresponding field.
Suggested groupings: assignee (for workload visibility), priority, tags, or row.
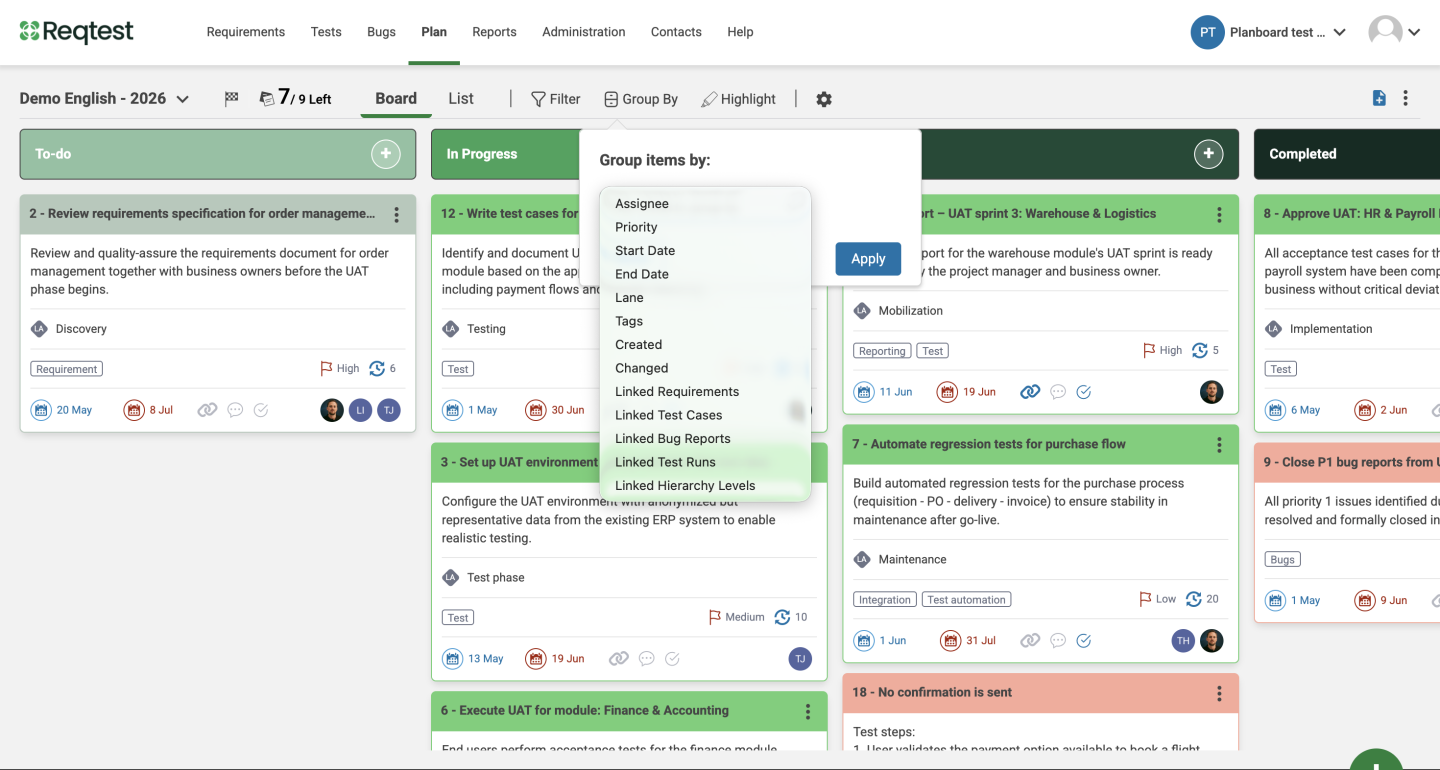
For fields that accept multiple values (e.g. Assigned), a task appears in each relevant group. This is by design, not duplication.
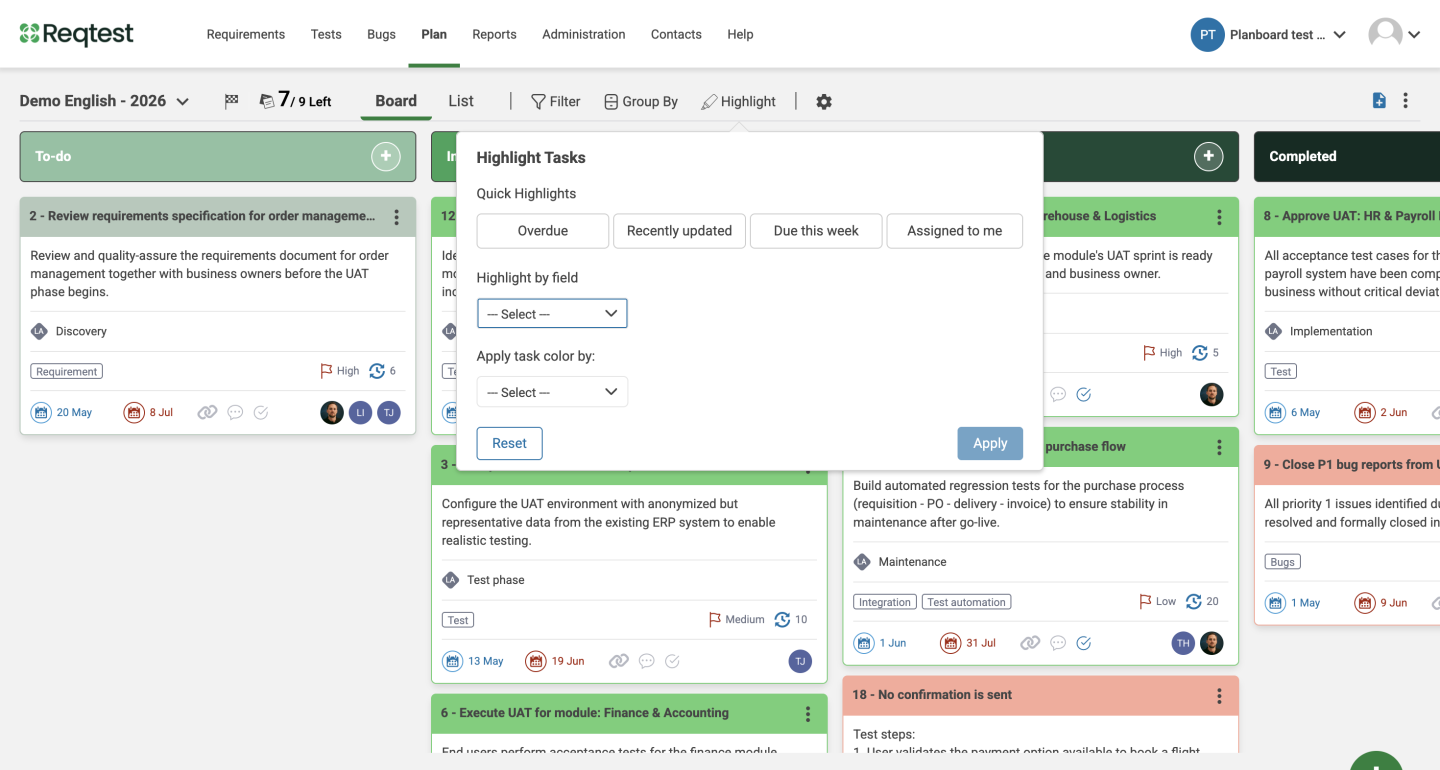
Highlighting
Click Highlight to dim tasks that do not match your selected criteria. Unlike filtering, no tasks are hidden – all remain visible on the board. Highlight by assignee, priority, tags, rows, date, or linked objects.
Apply task colour by field assigns colours to tasks automatically based on a field value, such as a distinct colour per assignee.
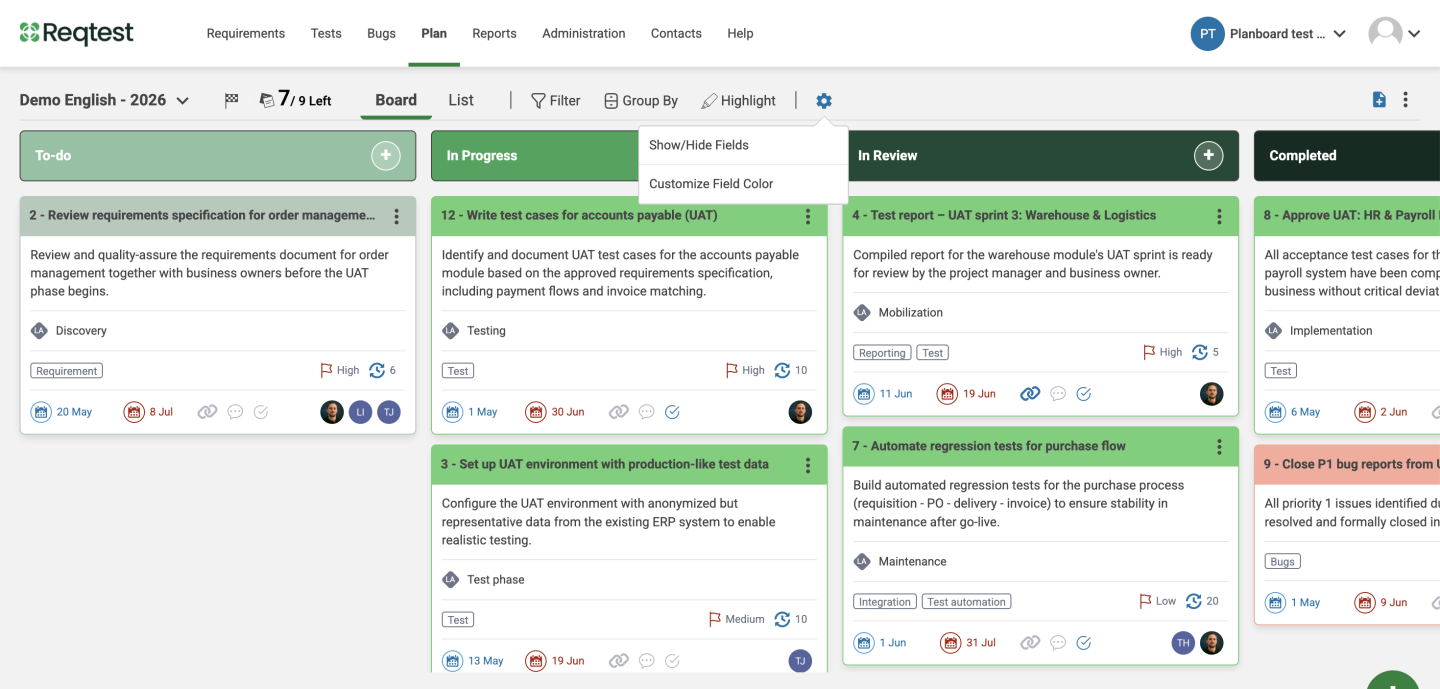
Settings
The gear icon on the board provides access to field visibility settings, colour customisation per field and user, and mirrored field management.
- Use Show/hide fields to control which fields appear on task cards
- Assign colours by field value – for example, a unique colour per assignee or per priority level
- Manage mirrored fields to review and update field mappings for mirror links
Hidden fields remain accessible in the task panel – they are not visible on the task card.
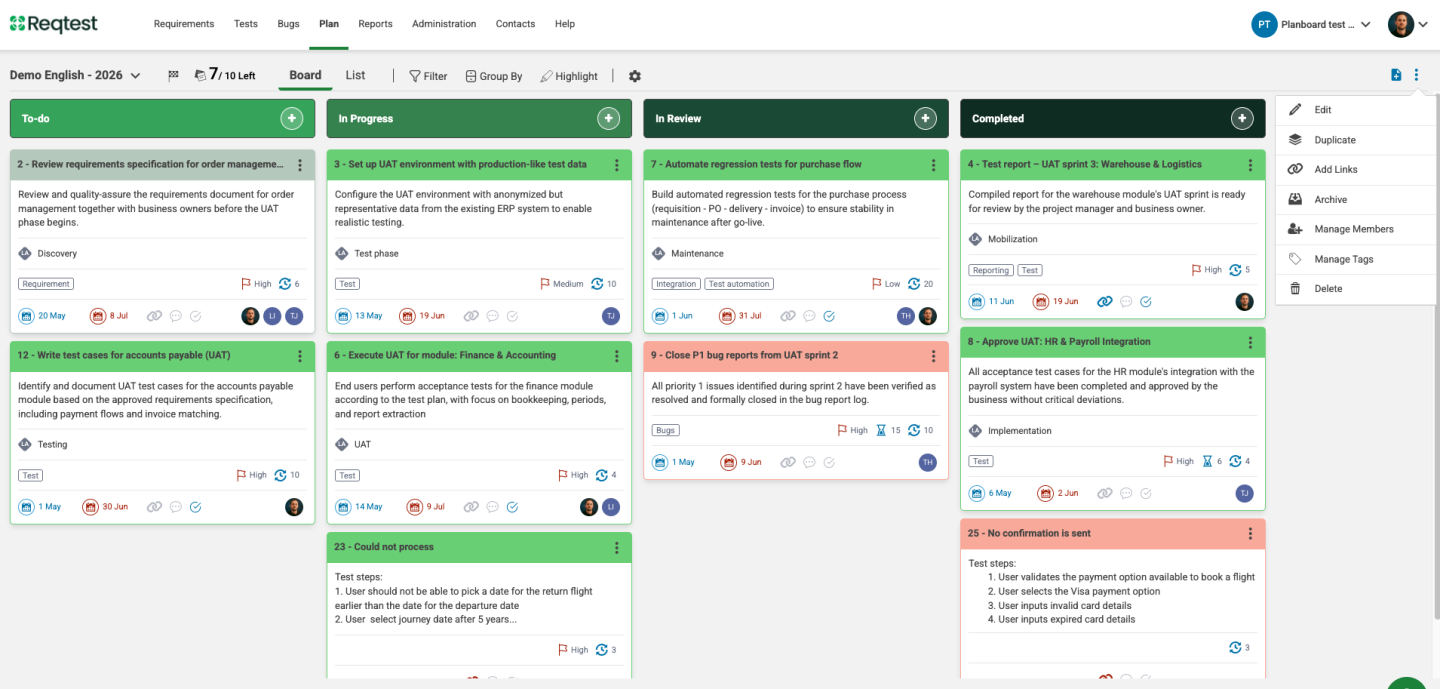
Additional settings
The board menu provides access to settings for managing the board at a higher level.
- Edit – Update the board’s name, objective, and columns.
- Duplicate – Create a copy of the board. Mirror links are transferred to the new board and removed from the original.
- Add links – Add normal or mirror links to tasks on the board.
- Archive – Archive the board to make it inactive.
- Manage members – Control whether all project members or specific individuals have access to the board. By default, all project members have access. To restrict access, select specific members manually – all other project members will be excluded. When creating a board, you can invite members during setup. To add members to an existing board, open the kebab menu and select Manage members.
- Manage tags – Create and manage tags for task categorisation. A task can have multiple tags.
- Delete – Permanently delete the board.
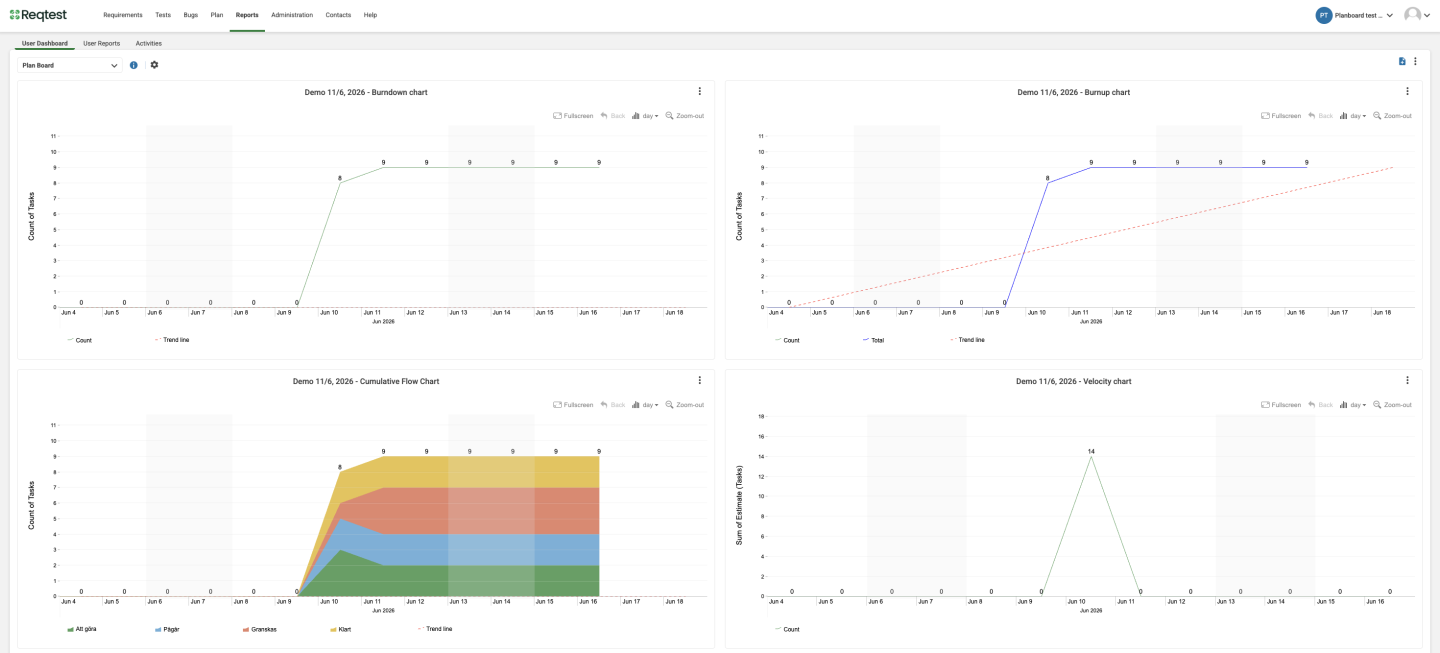
Reports
With reports, you can track and visualise work on the board over time. Choose the chart type based on what you want to measure – how much work remains, how fast the team is delivering, or where bottlenecks occur.
To create a report, go to Reports in the navigation and select Tasks as the data source. Select the board and chart type, then click Create.
Available chart types:
- Burndown chart – Tracks remaining work over time. The target is a line trending toward zero.
- Burnup chart – Tracks completed work against total scope, making scope changes visible.
- Velocity chart – Measures completed work sprint by sprint, useful for forecasting capacity.
- Cumulative flow diagram – Shows the distribution of tasks across workflow stages over time, useful for identifying bottlenecks.